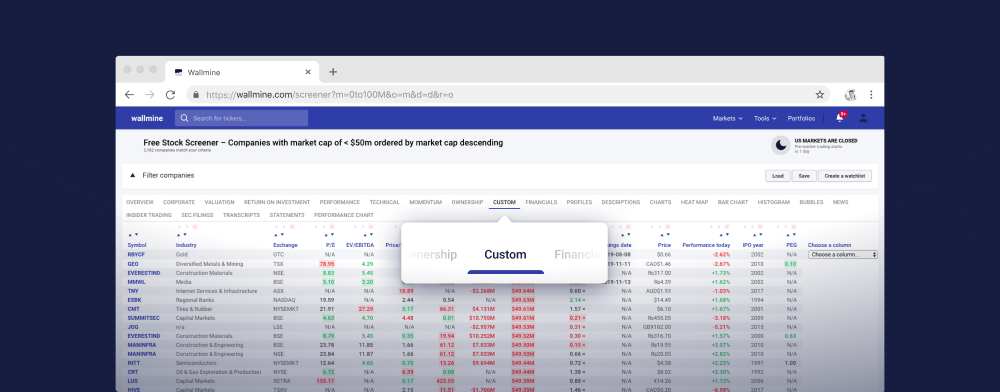
Free Stock Screener
Load Save Create a watchlist HelpProfit margin
Debt to assets
Cash flow
Balance sheet
 XSLX
XSLX
| (in millions USD) | 30 Mar 2018 | 30 Dec 2017 | |||
|---|---|---|---|---|---|
| Current assets | |||||
| Cash | $18.32 | $10.006 | |||
| Short term investments | $124.911 | $124.909 | |||
| Net receivables | |||||
| Inventory | |||||
| Total current assets | |||||
| Long term investments | $401.258 | $372.103 | |||
| Property, plant & equipment | |||||
| Goodwill & intangible assets | |||||
| Total noncurrent assets | |||||
| Total investments | |||||
| Total assets | $549.725 | $510.284 | |||
| Current liabilities | |||||
| Accounts payable | $143.66 | $135.906 | |||
| Deferred revenue | |||||
| Short long term debt | |||||
| Total current liabilities | |||||
| Long term debt | $169.56 | $139.433 | |||
| Total noncurrent liabilities | |||||
| Total debt | |||||
| Total liabilities | $313.22 | $275.339 | |||
| Stockholders' equity | |||||
| Retained earnings | $0.54 | $0.976 | |||
| Other stockholder equity | $0.3 | -$1.696 | |||
| Total stockholder equity | $236.505 | $234.945 | |||
| (in millions USD) | 2017 | 2016 | ||
|---|---|---|---|---|
| Current assets | ||||
| Cash | $10.006 | $15.478 | ||
| Short term investments | $124.909 | $39.99 | ||
| Net receivables | ||||
| Inventory | ||||
| Total current assets | ||||
| Long term investments | $372.103 | $374.311 | ||
| Property, plant & equipment | ||||
| Goodwill & intangible assets | ||||
| Total noncurrent assets | ||||
| Total investments | ||||
| Total assets | $510.284 | $434.222 | ||
| Current liabilities | ||||
| Accounts payable | $135.906 | $50.071 | ||
| Deferred revenue | ||||
| Short long term debt | ||||
| Total current liabilities | ||||
| Long term debt | $139.433 | $168.288 | ||
| Total noncurrent liabilities | ||||
| Total debt | ||||
| Total liabilities | $275.339 | $218.359 | ||
| Stockholders' equity | ||||
| Retained earnings | $0.976 | $0.082 | ||
| Other stockholder equity | -$1.696 | $3.608 | ||
| Total stockholder equity | $234.945 | $215.863 | ||
Income statement
| (in millions USD) | 30 Mar 2018 | 30 Dec 2017 | |||
|---|---|---|---|---|---|
| Revenue | |||||
| Total revenue | $10.101 | $8.905 | |||
| Cost of revenue | |||||
| Gross profit | $10.101 | $8.905 | |||
| Operating activities | |||||
| Research & development | |||||
| Selling, general & administrative | $4.154 | $3.756 | |||
| Total operating expenses | |||||
| Operating income | $5.947 | $5.149 | |||
| Income from continuing operations | |||||
| EBIT | $10.461 | $6.05 | |||
| Income tax expense | |||||
| Interest expense | $2.518 | $2.2 | |||
| Net income | |||||
| Net income | $7.943 | $3.85 | |||
| Income (for common shares) | $7.943 | $3.85 | |||
| (in millions USD) | 2017 | 2016 | ||
|---|---|---|---|---|
| Revenue | ||||
| Total revenue | $42.449 | $35.776 | ||
| Cost of revenue | ||||
| Gross profit | $42.449 | $35.776 | ||
| Operating activities | ||||
| Research & development | ||||
| Selling, general & administrative | $16.183 | $12.765 | ||
| Total operating expenses | ||||
| Operating income | $26.266 | $23.011 | ||
| Income from continuing operations | ||||
| EBIT | $28.288 | $18.985 | ||
| Income tax expense | ||||
| Interest expense | $9.061 | $7.859 | ||
| Net income | ||||
| Net income | $19.227 | $11.126 | ||
| Income (for common shares) | $19.227 | $11.126 | ||
Cash flows
| (in millions USD) | 30 Mar 2018 | 30 Dec 2017 | |||
|---|---|---|---|---|---|
| Net income | $7.943 | $3.85 | |||
| Operating activities | |||||
| Depreciation | -$2.581 | -$1.991 | |||
| Business acquisitions & disposals | |||||
| Stock-based compensation | |||||
| Total cash flows from operations | -$20.426 | -$60.68 | |||
| Investing activities | |||||
| Capital expenditures | |||||
| Investments | |||||
| Total cash flows from investing | |||||
| Financing activities | |||||
| Dividends paid | -$6.136 | ||||
| Sale and purchase of stock | $22.472 | ||||
| Net borrowings | $28.74 | $41.503 | |||
| Total cash flows from financing | $28.74 | $57.839 | |||
| Effect of exchange rate | |||||
| Change in cash and equivalents | $8.314 | -$2.841 | |||
| (in millions USD) | 2017 | 2016 | ||
|---|---|---|---|---|
| Net income | $19.227 | $11.126 | ||
| Operating activities | ||||
| Depreciation | -$1.667 | -$5.115 | ||
| Business acquisitions & disposals | ||||
| Stock-based compensation | ||||
| Total cash flows from operations | $25.102 | -$92.012 | ||
| Investing activities | ||||
| Capital expenditures | ||||
| Investments | ||||
| Total cash flows from investing | ||||
| Financing activities | ||||
| Dividends paid | -$22.617 | -$21.533 | ||
| Sale and purchase of stock | $22.472 | -$5.376 | ||
| Net borrowings | -$30.429 | $95.92 | ||
| Total cash flows from financing | -$30.574 | $69.011 | ||
| Effect of exchange rate | ||||
| Change in cash and equivalents | -$5.472 | -$23.001 | ||
Profit margin
Debt to assets
Cash flow
Balance sheet
| (in millions USD) | 30 Mar 2018 | 30 Dec 2017 | |||
|---|---|---|---|---|---|
| Current assets | |||||
| Cash | $2,527 | $2,120 | |||
| Short term investments | $2,279 | $3,743 | |||
| Net receivables | $683 | $695 | |||
| Inventory | |||||
| Total current assets | $6,763 | $7,743 | |||
| Long term investments | $5,919 | $6,331 | |||
| Property, plant & equipment | $1,548 | $1,597 | |||
| Goodwill & intangible assets | |||||
| Total noncurrent assets | |||||
| Total investments | |||||
| Total assets | $24,555 | $25,981 | |||
| Current liabilities | |||||
| Accounts payable | $2,406 | $2,641 | |||
| Deferred revenue | |||||
| Short long term debt | $20 | $781 | |||
| Total current liabilities | $2,568 | $3,539 | |||
| Long term debt | $9,208 | $9,234 | |||
| Total noncurrent liabilities | |||||
| Total debt | |||||
| Total liabilities | $16,959 | $17,918 | |||
| Stockholders' equity | |||||
| Retained earnings | $14,335 | $13,943 | |||
| Other stockholder equity | $800 | $717 | |||
| Total stockholder equity | $7,596 | $8,063 | |||
| (in millions USD) | 2017 | 2016 | ||
|---|---|---|---|---|
| Current assets | ||||
| Cash | $2,120 | $1,816 | ||
| Short term investments | $3,743 | $5,333 | ||
| Net receivables | $695 | $592 | ||
| Inventory | ||||
| Total current assets | $7,743 | $8,875 | ||
| Long term investments | $6,331 | $3,969 | ||
| Property, plant & equipment | $1,597 | $1,516 | ||
| Goodwill & intangible assets | ||||
| Total noncurrent assets | ||||
| Total investments | ||||
| Total assets | $25,981 | $23,847 | ||
| Current liabilities | ||||
| Accounts payable | $2,641 | $2,286 | ||
| Deferred revenue | ||||
| Short long term debt | $781 | $1,451 | ||
| Total current liabilities | $3,539 | $3,847 | ||
| Long term debt | $9,234 | $7,509 | ||
| Total noncurrent liabilities | ||||
| Total debt | ||||
| Total liabilities | $17,918 | $13,308 | ||
| Stockholders' equity | ||||
| Retained earnings | $13,943 | $14,959 | ||
| Other stockholder equity | $717 | -$124 | ||
| Total stockholder equity | $8,063 | $10,539 | ||
Income statement
| (in millions USD) | 30 Mar 2018 | 30 Dec 2017 | |||
|---|---|---|---|---|---|
| Revenue | |||||
| Total revenue | $2,580 | $2,613 | |||
| Cost of revenue | $559 | $590 | |||
| Gross profit | $2,021 | $2,023 | |||
| Operating activities | |||||
| Research & development | $334 | $317 | |||
| Selling, general & administrative | $1,098 | $1,033 | |||
| Total operating expenses | |||||
| Operating income | $579 | $663 | |||
| Income from continuing operations | |||||
| EBIT | $547 | $561 | |||
| Income tax expense | $140 | $3,158 | |||
| Interest expense | -$102 | ||||
| Net income | |||||
| Net income | $407 | -$2,601 | |||
| Income (for common shares) | $407 | -$2,601 | |||
| (in millions USD) | 2017 | 2016 | ||
|---|---|---|---|---|
| Revenue | ||||
| Total revenue | $9,567 | $8,979 | ||
| Cost of revenue | $2,222 | $2,007 | ||
| Gross profit | $7,345 | $6,972 | ||
| Operating activities | ||||
| Research & development | $1,224 | $1,114 | ||
| Selling, general & administrative | $3,818 | $3,499 | ||
| Total operating expenses | ||||
| Operating income | $2,265 | $2,325 | ||
| Income from continuing operations | ||||
| EBIT | $2,276 | $3,651 | ||
| Income tax expense | $3,288 | -$3,634 | ||
| Interest expense | -$292 | -$225 | ||
| Net income | ||||
| Net income | -$1,016 | $7,266 | ||
| Income (for common shares) | -$1,016 | $7,266 | ||
Cash flows
| (in millions USD) | 30 Mar 2018 | 30 Dec 2017 | |||
|---|---|---|---|---|---|
| Net income | $407 | -$2,601 | |||
| Operating activities | |||||
| Depreciation | $179 | $172 | |||
| Business acquisitions & disposals | |||||
| Stock-based compensation | |||||
| Total cash flows from operations | $495 | $988 | |||
| Investing activities | |||||
| Capital expenditures | -$158 | -$192 | |||
| Investments | $1,856 | $419 | |||
| Total cash flows from investing | $1,698 | $214 | |||
| Financing activities | |||||
| Dividends paid | |||||
| Sale and purchase of stock | -$1,000 | -$876 | |||
| Net borrowings | -$750 | -$2 | |||
| Total cash flows from financing | -$1,825 | -$896 | |||
| Effect of exchange rate | $38 | $54 | |||
| Change in cash and equivalents | $406 | $360 | |||
| (in millions USD) | 2017 | 2016 | ||
|---|---|---|---|---|
| Net income | -$1,016 | $7,266 | ||
| Operating activities | ||||
| Depreciation | $676 | $682 | ||
| Business acquisitions & disposals | ||||
| Stock-based compensation | ||||
| Total cash flows from operations | $3,146 | $2,826 | ||
| Investing activities | ||||
| Capital expenditures | -$666 | -$626 | ||
| Investments | -$593 | -$1,149 | ||
| Total cash flows from investing | -$1,296 | -$2,008 | ||
| Financing activities | ||||
| Dividends paid | ||||
| Sale and purchase of stock | -$2,626 | -$2,841 | ||
| Net borrowings | $1,032 | $2,196 | ||
| Total cash flows from financing | -$1,784 | -$744 | ||
| Effect of exchange rate | $238 | -$90 | ||
| Change in cash and equivalents | $304 | -$16 | ||
Profit margin
Debt to assets
Cash flow
Balance sheet
| (in millions USD) | 30 Mar 2018 | 30 Dec 2017 | |||
|---|---|---|---|---|---|
| Current assets | |||||
| Cash | $779 | $619 | |||
| Short term investments | $100 | ||||
| Net receivables | $965 | $963 | |||
| Inventory | $153 | $145 | |||
| Total current assets | $2,043 | $1,966 | |||
| Long term investments | $488 | $453 | |||
| Property, plant & equipment | $3,341 | $3,434 | |||
| Goodwill & intangible assets | |||||
| Total noncurrent assets | |||||
| Total investments | |||||
| Total assets | $9,481 | $9,295 | |||
| Current liabilities | |||||
| Accounts payable | $466 | $569 | |||
| Deferred revenue | |||||
| Short long term debt | $20 | $20 | |||
| Total current liabilities | $750 | $918 | |||
| Long term debt | $2,431 | $2,437 | |||
| Total noncurrent liabilities | |||||
| Total debt | |||||
| Total liabilities | $4,998 | $5,025 | |||
| Stockholders' equity | |||||
| Retained earnings | $2,696 | $2,525 | |||
| Other stockholder equity | -$3 | -$1 | |||
| Total stockholder equity | $4,472 | $4,269 | |||
| (in millions USD) | 2017 | 2016 | ||
|---|---|---|---|---|
| Current assets | ||||
| Cash | $619 | $900 | ||
| Short term investments | $100 | |||
| Net receivables | $963 | $861 | ||
| Inventory | $145 | $151 | ||
| Total current assets | $1,966 | $2,059 | ||
| Long term investments | $453 | $452 | ||
| Property, plant & equipment | $3,434 | $3,563 | ||
| Goodwill & intangible assets | ||||
| Total noncurrent assets | ||||
| Total investments | ||||
| Total assets | $9,295 | $9,446 | ||
| Current liabilities | ||||
| Accounts payable | $569 | $547 | ||
| Deferred revenue | ||||
| Short long term debt | $20 | $12 | ||
| Total current liabilities | $918 | $887 | ||
| Long term debt | $2,437 | $2,433 | ||
| Total noncurrent liabilities | ||||
| Total debt | ||||
| Total liabilities | $5,025 | $5,300 | ||
| Stockholders' equity | ||||
| Retained earnings | $2,525 | $2,454 | ||
| Other stockholder equity | -$1 | $1 | ||
| Total stockholder equity | $4,269 | $4,144 | ||
Income statement
| (in millions USD) | 30 Mar 2018 | 30 Dec 2017 | |||
|---|---|---|---|---|---|
| Revenue | |||||
| Total revenue | $1,225 | $1,308 | |||
| Cost of revenue | $534 | $637 | |||
| Gross profit | $691 | $671 | |||
| Operating activities | |||||
| Research & development | |||||
| Selling, general & administrative | $395 | $440 | |||
| Total operating expenses | |||||
| Operating income | $80 | $17 | |||
| Income from continuing operations | |||||
| EBIT | $124 | $57 | |||
| Income tax expense | $24 | -$318 | |||
| Interest expense | $43 | $42 | |||
| Net income | |||||
| Net income | $39 | $287 | |||
| Income (for common shares) | $39 | $287 | |||
| (in millions USD) | 2017 | 2016 | ||
|---|---|---|---|---|
| Revenue | ||||
| Total revenue | $5,044 | $5,155 | ||
| Cost of revenue | $2,359 | $2,429 | ||
| Gross profit | $2,685 | $2,726 | ||
| Operating activities | ||||
| Research & development | ||||
| Selling, general & administrative | $1,686 | $1,759 | ||
| Total operating expenses | ||||
| Operating income | -$105 | $111 | ||
| Income from continuing operations | ||||
| EBIT | $48 | $262 | ||
| Income tax expense | -$279 | $40 | ||
| Interest expense | $170 | $170 | ||
| Net income | ||||
| Net income | $153 | $43 | ||
| Income (for common shares) | $153 | $43 | ||
Cash flows
| (in millions USD) | 30 Mar 2018 | 30 Dec 2017 | |||
|---|---|---|---|---|---|
| Net income | $39 | $287 | |||
| Operating activities | |||||
| Depreciation | $221 | $212 | |||
| Business acquisitions & disposals | |||||
| Stock-based compensation | |||||
| Total cash flows from operations | $214 | $155 | |||
| Investing activities | |||||
| Capital expenditures | -$131 | -$287 | |||
| Investments | $100 | $100 | |||
| Total cash flows from investing | -$36 | -$303 | |||
| Financing activities | |||||
| Dividends paid | -$18 | -$20 | |||
| Sale and purchase of stock | $11 | $6 | |||
| Net borrowings | -$5 | -$8 | |||
| Total cash flows from financing | -$17 | -$18 | |||
| Effect of exchange rate | |||||
| Change in cash and equivalents | $161 | -$166 | |||
| (in millions USD) | 2017 | 2016 | ||
|---|---|---|---|---|
| Net income | $153 | $43 | ||
| Operating activities | ||||
| Depreciation | $844 | $850 | ||
| Business acquisitions & disposals | ||||
| Stock-based compensation | ||||
| Total cash flows from operations | $776 | $782 | ||
| Investing activities | ||||
| Capital expenditures | -$685 | -$636 | ||
| Investments | -$100 | -$100 | ||
| Total cash flows from investing | -$981 | -$808 | ||
| Financing activities | ||||
| Dividends paid | -$73 | -$66 | ||
| Sale and purchase of stock | $4 | $7 | ||
| Net borrowings | -$17 | -$10 | ||
| Total cash flows from financing | -$77 | -$59 | ||
| Effect of exchange rate | ||||
| Change in cash and equivalents | -$282 | -$85 | ||
Profit margin
Debt to assets
Cash flow
Balance sheet
| (in millions USD) | 31 Dec 2020 | 1 Oct 2020 | |||
|---|---|---|---|---|---|
| Current assets | |||||
| Cash | $773.3 | $766.1 | |||
| Short term investments | $34.4 | ||||
| Net receivables | $1,041.1 | $1,127.1 | |||
| Inventory | $571.7 | $516.3 | |||
| Other current assets | $10.4 | $79.9 | |||
| Total current assets | $2,641.3 | $2,603.3 | |||
| Long term investments | $45.8 | $133 | |||
| Property, plant & equipment | $466 | $465.9 | |||
| Goodwill | $627.7 | $623.9 | |||
| Intangible assets | $265 | $271.3 | |||
| Other assets | $480.3 | $364.8 | |||
| Deferred long term asset charges | $65.4 | $81.5 | |||
| Total assets | $4,526.1 | $4,462.2 | |||
| Current liabilities | |||||
| Accounts payable | $206.5 | $194.9 | |||
| Short long term debt | |||||
| Other current liabilities | $873.6 | $863.8 | |||
| Total current liabilities | $1,744.9 | $1,854.5 | |||
| Long term debt | |||||
| Other liabilities | $423.2 | $413.1 | |||
| Deferred long term liabilities | |||||
| Minority interest | $9.5 | $9.3 | |||
| Total liabilities | $2,278.3 | $2,377.4 | |||
| Stockholders' equity | |||||
| Stock option warrants | |||||
| Common stock | $91.8 | $91.2 | |||
| Retained earnings | $1,225.6 | $1,133 | |||
| Treasury stock | -$76.8 | -$85.7 | |||
| Capital surplus | $997.7 | $937 | |||
| Other stockholder equity | -$76.8 | -$85.7 | |||
| Total stockholder equity | $2,238.3 | $2,075.5 | |||
| Net tangible assets | $1,345.6 | $1,180.3 | |||
| (in millions USD) | 2020 | 2019 | ||
|---|---|---|---|---|
| Current assets | ||||
| Cash | $766.1 | $531.4 | ||
| Short term investments | $34.4 | |||
| Net receivables | $1,127.1 | $1,153.5 | ||
| Inventory | $516.3 | $551.5 | ||
| Other current assets | $79.9 | $80.1 | ||
| Total current assets | $2,603.3 | $2,395.4 | ||
| Long term investments | $133 | $122.4 | ||
| Property, plant & equipment | $465.9 | $311.5 | ||
| Goodwill | $623.9 | $612.2 | ||
| Intangible assets | $271.3 | $300.7 | ||
| Other assets | $364.8 | $359.5 | ||
| Deferred long term asset charges | $81.5 | $84.7 | ||
| Total assets | $4,462.2 | $4,101.7 | ||
| Current liabilities | ||||
| Accounts payable | $194.9 | $248.5 | ||
| Short long term debt | ||||
| Other current liabilities | $863.8 | $878.8 | ||
| Total current liabilities | $1,854.5 | $1,884 | ||
| Long term debt | ||||
| Other liabilities | $413.1 | $440.1 | ||
| Deferred long term liabilities | ||||
| Minority interest | $9.3 | $9.3 | ||
| Total liabilities | $2,377.4 | $2,324.1 | ||
| Stockholders' equity | ||||
| Stock option warrants | ||||
| Common stock | $91.2 | $90.8 | ||
| Retained earnings | $1,133 | $934 | ||
| Treasury stock | -$85.7 | -$102.1 | ||
| Capital surplus | $937 | $845.6 | ||
| Other stockholder equity | -$85.7 | -$102.1 | ||
| Total stockholder equity | $2,075.5 | $1,768.3 | ||
| Net tangible assets | $1,180.3 | $855.4 | ||
Income statement
| (in millions USD) | 31 Dec 2020 | 1 Oct 2020 | |||
|---|---|---|---|---|---|
| Revenue | |||||
| Total revenue | $778.8 | $850.5 | |||
| Cost of revenue | $419.8 | $475.8 | |||
| Gross profit | $359 | $374.7 | |||
| Operating activities | |||||
| Research & development | $72.2 | $77.2 | |||
| Selling, general & administrative | $161.6 | $179.3 | |||
| Non-recurring | |||||
| Other operating expenses | |||||
| Total operating expenses | $653.6 | $732.3 | |||
| Operating income | $125.2 | $118.2 | |||
| Income from continuing operations | |||||
| Net other income | -$0.8 | -$10.2 | |||
| EBIT | $125.2 | $118.2 | |||
| Interest expense | -$1.3 | -$2.1 | |||
| Income before tax | $124.4 | $108 | |||
| Income tax expense | $27.6 | $31.5 | |||
| Minority interest | $9.5 | $9.3 | |||
| Net income from continuing ops | $96.8 | $76.5 | |||
| Non-recurring events | |||||
| Discontinued operations | |||||
| Extraordinary items | |||||
| Effect of accounting change | |||||
| Other items | |||||
| Net income | |||||
| Net income | $96.5 | $76.6 | |||
| Income (for common shares) | $96.5 | $76.6 | |||
| (in millions USD) | 2020 | 2019 | ||
|---|---|---|---|---|
| Revenue | ||||
| Total revenue | $3,168.2 | $3,225.1 | ||
| Cost of revenue | $1,791 | $1,854.8 | ||
| Gross profit | $1,377.2 | $1,370.3 | ||
| Operating activities | ||||
| Research & development | $280.6 | $247.6 | ||
| Selling, general & administrative | $675 | $624.6 | ||
| Non-recurring | ||||
| Other operating expenses | ||||
| Total operating expenses | $2,746.6 | $2,727 | ||
| Operating income | $421.6 | $498.1 | ||
| Income from continuing operations | ||||
| Net other income | -$63.3 | -$77.3 | ||
| EBIT | $421.6 | $498.1 | ||
| Interest expense | -$14 | -$8.8 | ||
| Income before tax | $358.3 | $420.8 | ||
| Income tax expense | $88.9 | $128.6 | ||
| Minority interest | $9.3 | $9.3 | ||
| Net income from continuing ops | $269.4 | $292.2 | ||
| Non-recurring events | ||||
| Discontinued operations | ||||
| Extraordinary items | ||||
| Effect of accounting change | ||||
| Other items | ||||
| Net income | ||||
| Net income | $269.2 | $291.9 | ||
| Income (for common shares) | $269.2 | $291.9 | ||
Cash flows
| (in millions USD) | 31 Dec 2020 | 1 Oct 2020 | |||
|---|---|---|---|---|---|
| Net income | $96.5 | $76.6 | |||
| Operating activities | |||||
| Depreciation | $25.8 | $25.3 | |||
| Net income adjustments | $24.2 | $45.9 | |||
| Change in accounts receivable | $29.1 | -$49.1 | |||
| Changes in liabilities | $78.9 | $28.5 | |||
| Changes in inventory | -$52.5 | $87.5 | |||
| Changes in other operating activities | -$60.6 | $51.9 | |||
| Total cash flows from operations | $141.4 | $266.6 | |||
| Investing activities | |||||
| Capital expenditures | -$16.8 | -$29.3 | |||
| Investments | -$10.3 | -$5 | |||
| Other cash flows from investing | -$0.9 | ||||
| Total cash flows from investing | -$27.6 | -$63 | |||
| Financing activities | |||||
| Dividends paid | |||||
| Sale and purchase of stock | |||||
| Net borrowings | -$145 | -$225 | |||
| Other cash flows from financing | -$2.9 | ||||
| Total cash flows from financing | -$100.2 | -$204.4 | |||
| Effect of exchange rate | -$6.3 | -$3.9 | |||
| Change in cash and equivalents | $7.3 | -$4.7 | |||
| (in millions USD) | 2020 | 2019 | ||
|---|---|---|---|---|
| Net income | $269.2 | $291.9 | ||
| Operating activities | ||||
| Depreciation | $98.8 | $81.1 | ||
| Net income adjustments | $104.5 | $151.5 | ||
| Change in accounts receivable | $35.2 | -$111.7 | ||
| Changes in liabilities | -$55.7 | $120.8 | ||
| Changes in inventory | $39.8 | -$106.9 | ||
| Changes in other operating activities | -$7.7 | -$54.9 | ||
| Total cash flows from operations | $484.1 | $371.8 | ||
| Investing activities | ||||
| Capital expenditures | -$84.3 | -$58 | ||
| Investments | -$17.1 | $5.6 | ||
| Other cash flows from investing | -$2.7 | -$3.1 | ||
| Total cash flows from investing | -$140.3 | -$631.7 | ||
| Financing activities | ||||
| Dividends paid | ||||
| Sale and purchase of stock | ||||
| Net borrowings | -$55 | $393.2 | ||
| Other cash flows from financing | -$15.1 | $3.8 | ||
| Total cash flows from financing | -$93.1 | $279.2 | ||
| Effect of exchange rate | -$9 | $8.4 | ||
| Change in cash and equivalents | $241.7 | $27.7 | ||
0F2Q
Profit margin
Debt to assets
Cash flow
Balance sheet
| (in millions EUR) | 30 Dec 2021 | 29 Sep 2021 | |||
|---|---|---|---|---|---|
| Current assets | |||||
| Cash | €39.273 | €71.233 | |||
| Short term investments | €73.108 | ||||
| Net receivables | €147.638 | €134.849 | |||
| Inventory | €256.653 | €264.219 | |||
| Other current assets | €6.06 | ||||
| Total current assets | €525.124 | €470.301 | |||
| Long term investments | €0.639 | €0.699 | |||
| Property, plant & equipment | €214.335 | €212.25 | |||
| Goodwill | €10.401 | ||||
| Intangible assets | €6.696 | €7.894 | |||
| Other assets | €9.035 | €21.281 | |||
| Deferred long term asset charges | €6.23 | ||||
| Total assets | €766.23 | €712.425 | |||
| Current liabilities | |||||
| Accounts payable | €152.287 | €172.765 | |||
| Short long term debt | €24.773 | ||||
| Other current liabilities | €30.971 | €33.702 | |||
| Total current liabilities | €312.927 | €262.22 | |||
| Long term debt | €98.365 | €106 | |||
| Other liabilities | €27.81 | €25.748 | |||
| Deferred long term liabilities | €1.841 | ||||
| Minority interest | €0.104 | €0.104 | |||
| Total liabilities | €439.102 | €393.968 | |||
| Stockholders' equity | |||||
| Stock option warrants | |||||
| Common stock | €46.15 | €318.353 | |||
| Retained earnings | €229.011 | ||||
| Treasury stock | €36.536 | ||||
| Capital surplus | €15.327 | ||||
| Other stockholder equity | €36.536 | ||||
| Total stockholder equity | €327.024 | €318.353 | |||
| Net tangible assets | €309.927 | €310.459 | |||
| (in millions EUR) | 2021 | 2020 | ||
|---|---|---|---|---|
| Current assets | ||||
| Cash | €39.273 | €51.085 | ||
| Short term investments | €73.108 | €37.311 | ||
| Net receivables | €147.638 | €128.133 | ||
| Inventory | €256.653 | €247.215 | ||
| Other current assets | €6.06 | €8.943 | ||
| Total current assets | €525.124 | €472.687 | ||
| Long term investments | €0.639 | €0.729 | ||
| Property, plant & equipment | €214.335 | €219.475 | ||
| Goodwill | €10.401 | €10.401 | ||
| Intangible assets | €6.696 | €7.507 | ||
| Other assets | €9.035 | €6.857 | ||
| Deferred long term asset charges | €6.23 | €5.78 | ||
| Total assets | €766.23 | €717.656 | ||
| Current liabilities | ||||
| Accounts payable | €152.287 | €138.381 | ||
| Short long term debt | €24.773 | €37.637 | ||
| Other current liabilities | €30.971 | €33.786 | ||
| Total current liabilities | €312.927 | €313.502 | ||
| Long term debt | €98.365 | €87.275 | ||
| Other liabilities | €27.81 | €25.425 | ||
| Deferred long term liabilities | €1.841 | €2.041 | ||
| Minority interest | €0.104 | €0.07 | ||
| Total liabilities | €439.102 | €426.202 | ||
| Stockholders' equity | ||||
| Stock option warrants | ||||
| Common stock | €46.15 | €46.15 | ||
| Retained earnings | €229.011 | €200.571 | ||
| Treasury stock | €36.536 | €29.336 | ||
| Capital surplus | €15.327 | €15.327 | ||
| Other stockholder equity | €36.536 | €29.336 | ||
| Total stockholder equity | €327.024 | €291.384 | ||
| Net tangible assets | €309.927 | €273.476 | ||
Income statement
| (in millions EUR) | 30 Dec 2021 | 29 Sep 2021 | |||
|---|---|---|---|---|---|
| Revenue | |||||
| Total revenue | €242.721 | €207.147 | |||
| Cost of revenue | €201.26 | €183.407 | |||
| Gross profit | €41.461 | €23.74 | |||
| Operating activities | |||||
| Research & development | |||||
| Selling, general & administrative | €0.004 | €0.004 | |||
| Non-recurring | |||||
| Other operating expenses | €12.334 | €12.334 | |||
| Total operating expenses | €220.615 | €189.093 | |||
| Operating income | €22.106 | €18.054 | |||
| Income from continuing operations | |||||
| Net other income | -€8.852 | €4.224 | |||
| EBIT | €22.106 | €18.054 | |||
| Interest expense | -€2.733 | -€0.203 | |||
| Income before tax | €13.254 | €22.278 | |||
| Income tax expense | €4.172 | €5.807 | |||
| Minority interest | €0.104 | €0.104 | |||
| Net income from continuing ops | €9.082 | €16.471 | |||
| Non-recurring events | |||||
| Discontinued operations | |||||
| Extraordinary items | |||||
| Effect of accounting change | |||||
| Other items | |||||
| Net income | |||||
| Net income | €9.083 | €16.451 | |||
| Income (for common shares) | €9.083 | €16.451 | |||
| (in millions EUR) | 2021 | 2020 | ||
|---|---|---|---|---|
| Revenue | ||||
| Total revenue | €873.677 | €862.158 | ||
| Cost of revenue | €774.304 | €764.643 | ||
| Gross profit | €99.373 | €97.515 | ||
| Operating activities | ||||
| Research & development | ||||
| Selling, general & administrative | €0.004 | €1.895 | ||
| Non-recurring | ||||
| Other operating expenses | €12.334 | €14.404 | ||
| Total operating expenses | €809.08 | €797.38 | ||
| Operating income | €64.597 | €64.778 | ||
| Income from continuing operations | ||||
| Net other income | -€2.701 | €12.739 | ||
| EBIT | €64.597 | €64.778 | ||
| Interest expense | -€3.356 | -€11.697 | ||
| Income before tax | €61.896 | €68.228 | ||
| Income tax expense | €15.177 | €11.545 | ||
| Minority interest | €0.104 | €0.07 | ||
| Net income from continuing ops | €46.719 | €56.683 | ||
| Non-recurring events | ||||
| Discontinued operations | ||||
| Extraordinary items | ||||
| Effect of accounting change | ||||
| Other items | ||||
| Net income | ||||
| Net income | €46.721 | €56.684 | ||
| Income (for common shares) | €46.721 | €56.684 | ||
Cash flows
| (in millions EUR) | 30 Dec 2021 | 29 Sep 2021 | |||
|---|---|---|---|---|---|
| Net income | €9.083 | €16.451 | |||
| Operating activities | |||||
| Depreciation | |||||
| Net income adjustments | |||||
| Change in accounts receivable | |||||
| Changes in liabilities | |||||
| Changes in inventory | |||||
| Changes in other operating activities | |||||
| Total cash flows from operations | |||||
| Investing activities | |||||
| Capital expenditures | |||||
| Investments | |||||
| Other cash flows from investing | |||||
| Total cash flows from investing | |||||
| Financing activities | |||||
| Dividends paid | |||||
| Sale and purchase of stock | |||||
| Net borrowings | |||||
| Other cash flows from financing | |||||
| Total cash flows from financing | |||||
| Effect of exchange rate | |||||
| Change in cash and equivalents | |||||
| (in millions EUR) | 2021 | 2020 | ||
|---|---|---|---|---|
| Net income | €46.721 | €56.684 | ||
| Operating activities | ||||
| Depreciation | €19.134 | €16.979 | ||
| Net income adjustments | -€0.777 | -€9.994 | ||
| Change in accounts receivable | -€15.859 | -€16.317 | ||
| Changes in liabilities | €13.906 | €10.99 | ||
| Changes in inventory | -€9.438 | -€28.164 | ||
| Changes in other operating activities | -€1.521 | €3.45 | ||
| Total cash flows from operations | €47.753 | €41.833 | ||
| Investing activities | ||||
| Capital expenditures | -€13.708 | -€14.018 | ||
| Investments | €0.025 | €0.041 | ||
| Other cash flows from investing | €5.129 | €1.184 | ||
| Total cash flows from investing | -€10.991 | -€15.966 | ||
| Financing activities | ||||
| Dividends paid | -€17.684 | -€7.567 | ||
| Sale and purchase of stock | ||||
| Net borrowings | -€37.573 | €0.332 | ||
| Other cash flows from financing | ||||
| Total cash flows from financing | -€55.257 | -€9.135 | ||
| Effect of exchange rate | €5.821 | -€4.314 | ||
| Change in cash and equivalents | -€11.812 | €9.041 | ||